

TL;DR: Incrementality testing shows which sales your ads actually caused. Since May 2025, Google lets advertisers run lift studies from a $5,000 budget, and Meta’s free GeoLift package handles DIY geo holdouts. You need 52 weeks of daily regional sales, 20 or more regions, and at least 15 days of testing. Start with brand search or retargeting.
What incrementality testing measures (and attribution can’t)
Attribution answers one question: which ad touched the order before it happened. Incrementality testing answers a harder one: would the order have happened anyway?
The gap between those two answers is where budget leaks. A retargeting ad can get credit for a returning customer’s order and still have caused nothing. That customer was already coming back.
A geo holdout finds the gap. You turn ads off in some regions and leave them on in others. Then you compare sales across the two groups. Take the extra revenue in the ads-on regions and divide it by the spend there. That’s your incremental return on ad spend (iROAS).
Attribution still matters for daily optimization. Our breakdown of B2B attribution models, from first-touch to data-driven, covers how each model assigns credit. None of them can tell you what would have happened with zero spend. Only a controlled test can.
Why platform ROAS overstates what your ads earn
The best-known public example comes from eBay. The National Bureau of Economic Research published the field experiments in May 2014. Economists Thomas Blake, Chris Nosko, and Steven Tadelis switched off Google search ads in some US cities and kept them running in others.
The results were blunt. Brand keyword ads had “no measurable short-term benefits,” according to the paper. For non-brand keywords, frequent eBay shoppers bought anyway and absorbed most of the spend. That pushed average returns below zero.
The reason is simple. People who click a brand ad were usually searching for you already. Remove the ad and many of them click the organic listing right below it.
eCommerce accounts face the same trap today, with more channels stacked on top. Performance Max, Standard Shopping, Meta Advantage+, and retargeting all claim the same buyer. Each dashboard counts that shared order as its own win. Add up the platform totals and you get more revenue than your Shopify admin shows.
Incrementality testing is now affordable for mid-size stores
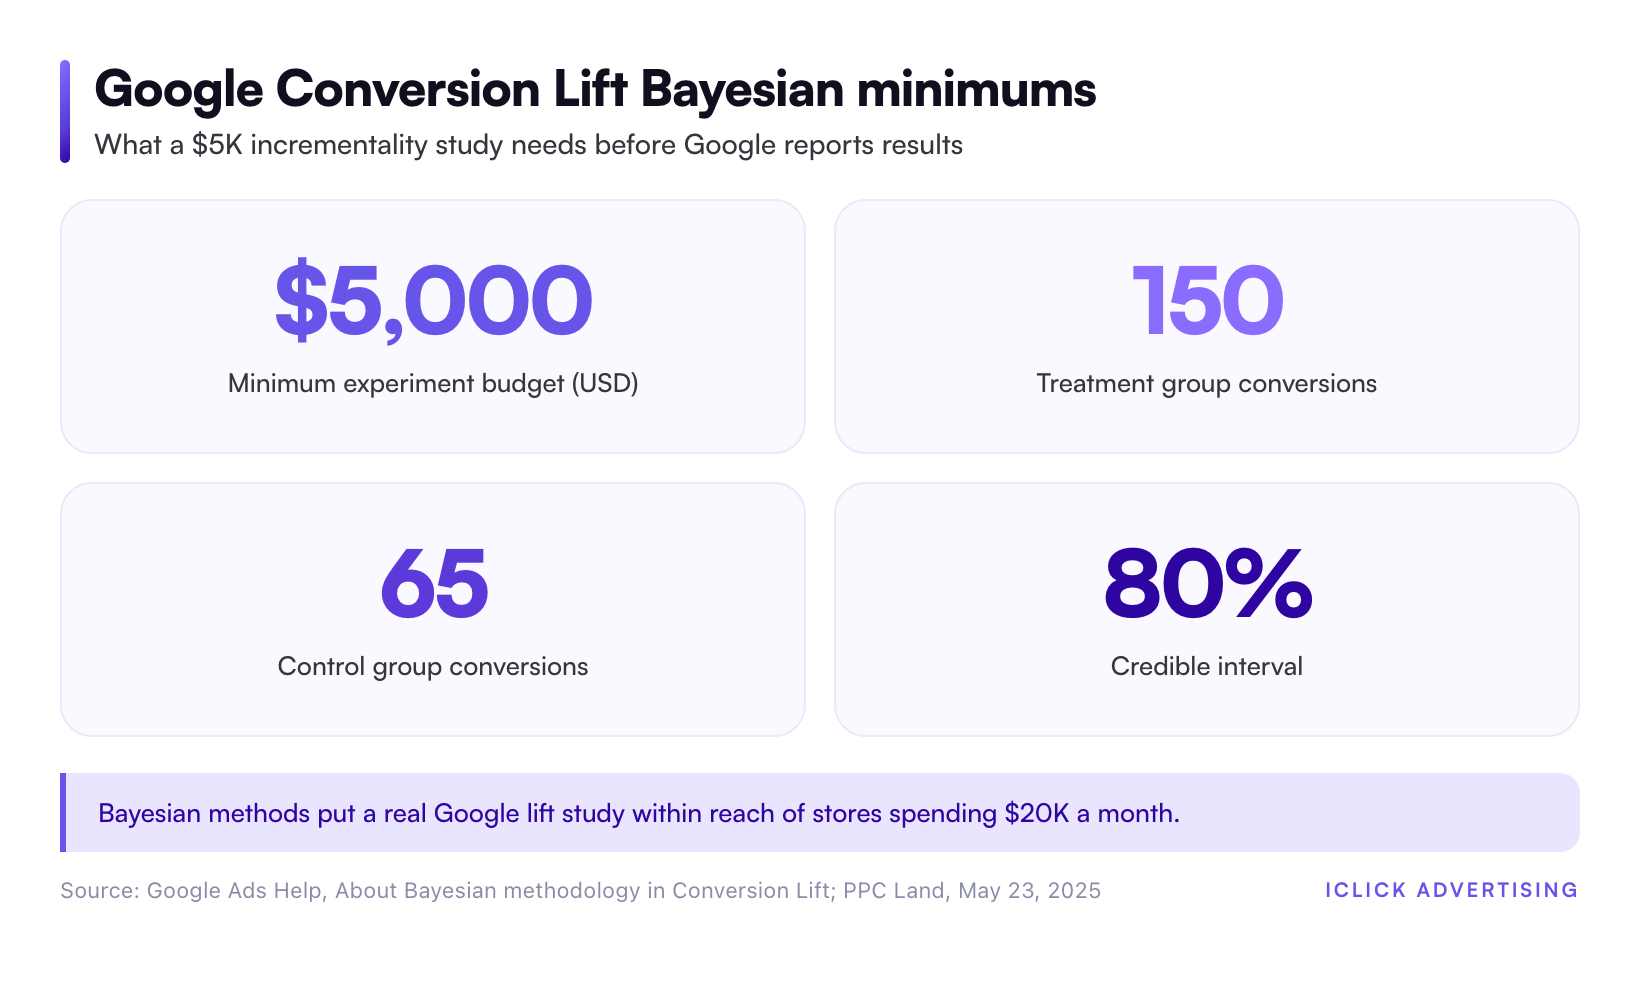
For years, lift studies were a big-brand tool. That changed at Google Marketing Live on May 22, 2025. PPC Land reported that Ginny Marvin, Google’s Ads Product Liaison, said advertisers could “launch an incrementality test with an experiment budget as low as $5K.”
The lower minimum comes from a switch to Bayesian statistics. Google’s help page on Bayesian methodology in Conversion Lift sets a reporting threshold. Results need at least 150 conversions from the treatment group and 65 from the control group. Lift is reported with an 80% credible interval.
That puts a real lift study within reach of a store spending $20,000 a month on Google. The catch is access. Google’s Conversion Lift documentation says the tool isn’t available for all accounts. You need to contact your Google account representative to use it.
Your three options, compared
| Method | Cost | Who runs it | Best for | Main limit |
|---|---|---|---|---|
| Google Conversion Lift based on geography | $5,000 minimum for Bayesian studies; final budget set by Google’s feasibility check | Google, inside Google Ads | Search, Shopping, and Performance Max | Campaigns must target a single country; access goes through your Google rep |
| GeoLift (Meta’s open-source R package) | Free software plus analyst time | You or your agency | Any channel, including cross-channel tests | Needs a year of clean daily sales by region |
| Matched-market spreadsheet test | Free | You | A quick directional read on one channel | No synthetic control, so it’s easy to fool yourself |
Google’s tool is the easiest path for Google spend. GeoLift is the better choice for Meta. It also lets you test several channels with the same method.
How to run a geo holdout on a budget in seven steps
Step 1: Fix your conversion data first
A lift test is only as good as the sales data you feed it. If Shopify orders don’t reach Google Ads and Meta cleanly, both your test and control groups will be noisy.
Start with Shopify conversion tracking in 2026 with GA4, Enhanced Conversions, and the Conversions API. Then close the Meta gap with the Meta Conversions API setup for Shopify that most stores are missing.
For the test itself, use Shopify order data by shipping region as your outcome. It’s the one number no ad platform can inflate.
Step 2: Ask one question
Pick one channel and one decision. Good eCommerce questions look like this:
- Does brand search drive sales we wouldn’t get from organic listings?
- Does Meta retargeting add orders, or just claim them?
- Does Performance Max add revenue beyond Standard Shopping?
“Is our marketing working?” is not a testable question. It has too many moving parts for one holdout.
Step 3: Pull 52 weeks of daily sales by region
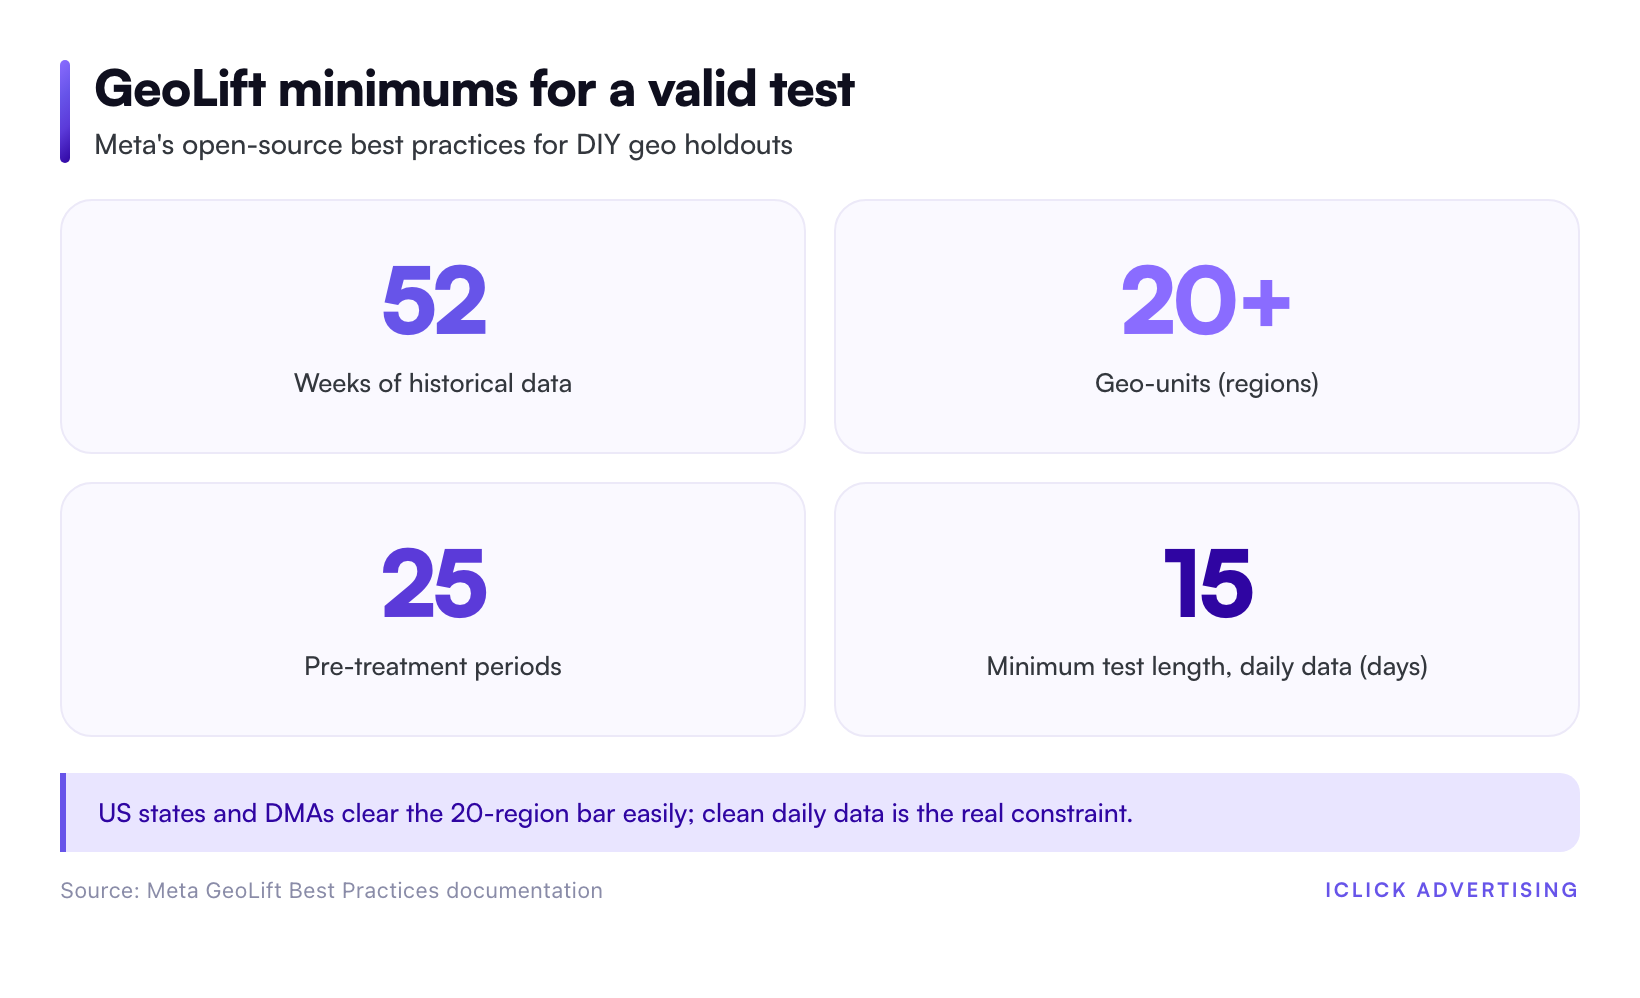
Meta’s GeoLift best-practice documentation recommends historical data “over the last 52 weeks.” It also asks for stable pre-campaign history of at least 4 to 5 times the test length. It strongly recommends daily data over weekly.
Export daily orders or revenue by state, DMA, or city from Shopify. Remove regions with gaps. The GeoLift walkthrough notes that locations with missing values or incomplete timestamps get dropped anyway.
Step 4: Choose enough regions
GeoLift’s best practices call for 25 pre-treatment periods across 20 or more geo-units. US states and DMAs clear that bar easily. Canada’s 13 provinces and territories don’t, so Canadian stores usually test at the city level.
Match test and control regions on sales volume and trend, not gut feel. GeoLift’s market selection function runs simulations to find the best combination. For each option it shows the minimum detectable effect and the minimum investment needed.
Step 5: Set the test length around your buying cycle
GeoLift recommends at least 15 days on daily data, or 4 to 6 weeks on weekly data. The test should also cover at least one full purchase cycle.
A low-cost skincare refill might sell on impulse. A premium massage chair might take weeks of research. Size the window to your slowest common path to purchase, not your fastest.
Step 6: Freeze everything else
During the test, don’t launch a sale, change prices, or restructure campaigns. Any change that hits test and control regions unevenly breaks the comparison.
Keep location targeting clean in Google Ads and Meta Ads Manager. Exclude holdout regions at the campaign level. Then check the geographic report after two days to confirm spend really stopped there.
Step 7: Read iROAS, not ROAS
The formula is short: iROAS equals incremental revenue divided by the spend in the test regions. Incremental revenue is actual sales in the test regions minus the model’s forecast for those regions without ads.
Here is a hypothetical to show the math. Your Shopping campaigns report 4.8x ROAS. That matches the 480% iClick sees in well-managed Shopping accounts in our 2026 benchmark data. You spend $10,000 in test regions. The dashboard claims $48,000 in revenue. The geo test shows only $30,000 above the forecast.
Your iROAS is 3.0, not 4.8. In that example, $18,000 of the claimed revenue, or 37.5%, would have arrived without the ads. That’s the number you use to set budgets.
Where to test first in an eCommerce account
Brand search
Brand campaigns are the cheapest test to run and the most likely to surprise you. The eBay study is the warning. If you rank first organically and few competitors bid on your name, a brand holdout is worth running.
Meta retargeting
Retargeting audiences are full of people who already plan to buy. Costs are rising too. Meta CPMs in iClick’s portfolio reached $11.54 in our 2026 benchmarks, up 38% year over year. At that price per impression, you can’t afford to skip the “would they have bought anyway” question.
Performance Max versus Standard Shopping
In iClick’s 2026 benchmark data, Performance Max cannibalizes Shopping in 80%+ of the accounts we run. Turn off Performance Max in some regions and compare. The test shows whether it adds new buyers or just reroutes Shopping sales through a different campaign.
Five mistakes that ruin a budget geo test
- Too few regions. Fewer than 20 geo-units makes the synthetic control shaky. Your result will swing on one city’s bad week.
- Too short a window. Treat the 15-day minimum as a starting point, not a target. Products with long consideration periods need longer tests.
- Using platform-attributed revenue as the outcome. Measure Shopify orders by region. Otherwise you’re testing the platform’s model, not your sales.
- Calling it early. Google won’t report Conversion Lift results before the fourth reporting day. Its help page says processing can take up to 10 days because of conversion lag.
- Testing during a promotion. Black Friday, a sitewide sale, or a viral post will swamp the signal. Pick a quiet stretch of the calendar.
Where incrementality fits in your measurement stack
A geo test is a snapshot, not a dashboard. Run one per quarter on your largest line item. Then use the result to adjust the credit attribution gives that channel until the next test.
Blended numbers are your daily sanity check between tests. When Zager Guitars grew from $300K to $1.5M in monthly revenue, iClick tracked an 8.4 blended ROAS. That means total revenue over total ad spend, not any one platform’s claim.
Our measurement and tracking playbook for paid media has the full framework. It covers tracking, attribution, incrementality, and blended metrics.
Not sure your numbers would survive a holdout?
Most stores find tracking gaps before they ever get to a lift test. iClick’s Free Written Audit is a 47-point PDF review of your Google and Meta accounts. It covers conversion tracking, channel overlap, and where your reported ROAS is likely inflated. It arrives in five business days, with no sales call.
Sources
- Blake, Nosko, and Tadelis, Consumer Heterogeneity and Paid Search Effectiveness: A Large Scale Field Experiment, NBER Working Paper 20171 (May 2014)
- PPC Land, Google cuts incrementality testing budget requirements to $5,000 minimum (May 23, 2025)
- Google Ads Help, About Bayesian methodology in Conversion Lift
- Google Ads Help, Set up Conversion Lift based on geography
- Google Ads Help, About Conversion Lift
- Meta GeoLift, Best Practices
- Meta GeoLift, Walkthrough
- iClick Advertising, 2026 PPC Benchmarks (first-party portfolio data)
Frequently asked questions
What is incrementality testing in eCommerce?
Incrementality testing measures the sales your ads caused, not just the sales they touched. You split customers or regions into a group that sees ads and a group that doesn’t. The difference in sales between the two groups is the incremental lift. It shows whether a channel creates new orders or just takes credit for orders that would have happened anyway.
How much budget do I need for a geo holdout test?
Google’s Bayesian Conversion Lift studies start at a $5,000 experiment budget, per Google’s own help documentation. Results also need at least 150 conversions in the treatment group and 65 in the control group. A DIY test with Meta’s free GeoLift package has no minimum spend. It does need enough regional sales volume to detect a lift, and its power simulations estimate that for you.
How long should an incrementality test run?
Meta’s GeoLift best practices recommend at least 15 days with daily data, or 4 to 6 weeks with weekly data. The test should also cover at least one full purchase cycle for your product. Low-cost impulse items can test on the short end. High-ticket products with long research periods need longer windows to capture delayed orders.
What is the difference between ROAS and iROAS?
ROAS divides the revenue a platform attributes to your ads by your ad spend. iROAS divides only the incremental revenue, meaning sales that wouldn’t have happened without the ads, by that spend. iROAS is usually lower, sometimes by a lot. In the eBay search experiments, brand keyword ads showed no measurable short-term benefit, even though attribution credited them with sales.